
To calculate sell-through rate for your active inventory, divide sold units by total stock (beginning inventory plus new arrivals) over a specific timeframe, then multiply by 100. For sourcing research, divide sold listings by total active listings on a marketplace. A healthy reseller sell-through rate typically sits between 20% and 40% monthly.
Key takeaways
- Calculate sourcing demand by dividing 90-day sold listings by active listings, then divide by three for a monthly rate
- A sell-through rate above 80% often signals underpricing, while anything under 15% creates cash flow bottlenecks
- Always examine total sales volume alongside percentages to avoid chasing single-sale statistical anomalies
- Cross-listing across European channels multiplies buyer impressions without requiring additional capital investments
- Purge or discount stagnant stock approaching 90 days to free up operational capital and maintain marketplace algorithmic health
Cash flow kills reselling businesses faster than bad sourcing. You can fill three storage units with designer trench coats, rare vintage cameras, and pristine mid-century chairs, but if those items sit for nine months, your capital remains trapped. Knowing your numbers separates serious commerce operators from hobbyists running expensive storage facilities. At the core of that mathematical discipline sits one metric: the sell-through rate (STR).
Whether you clear inventory out of a spare bedroom in Antwerp, run a warehouse outside Utrecht, or flip electronics across the European Union, this calculation dictates what you buy, how you price, and when you liquidate. In 2026, shifting marketplace algorithms and tighter economic conditions make inventory velocity far more valuable than paper profit margins. Here is how to calculate, interpret, and manipulate your sell-through rate across every channel you sell on.
What is inventory and how does inventory management apply to reselling?
In traditional retail, inventory represents brand-new goods ordered in bulk from distributors or manufacturers. A store manager buys 500 units of the exact same white sneaker across six sizes, puts them on display, and tracks how many pairs leave the store every thirty days. Retail inventory management focuses on lead times, factory reorder points, safety stock minimums, and holding costs.
Second-hand and resale commerce operates under an entirely different logic. For most independent resellers, inventory consists of unique, one-off (OOAK) used goods sourced from house clearances, thrift stores, flea markets, consumer buyouts, and return pallets. You do not reorder a 1994 Carhartt Detroit jacket when it sells. You cannot call a supplier for another rare board game once a buyer checks out on Marktplaats.
Because every item has a unique acquisition cost, condition profile, and market demand curve, inventory management for resellers means managing capital allocation and storage shelf life. The goal is simple: turn available cash into listed stock, convert that listed stock back into cash plus margin, and repeat the cycle before depreciation, storage fees, or seasonal demand shifts erode your return. Understanding how to organize inventory for reselling ensures you know your exact starting stock figures, which are mandatory for accurate performance tracking.
Can sell-through rate be applied to industries other than retail?
Yes. The metric originated in supply chain logistics and manufacturing, but it governs dozens of asset-heavy sectors:
- Automotive and machinery auctions: Auction houses measure the percentage of lots that hammer down versus those that pass reserve prices.
- Real estate developments: Property developers track the rate at which newly constructed apartments get signed under purchase contracts each quarter.
- Ticketing and live events: Concert promoters and airlines calculate capacity sell-through up to the departure or show date.
- Wholesale salvage: Pallet liquidators calculate how fast recovered freight moves out of transit depots to prevent demurrage charges.
In every instance, the core question remains identical: out of the total inventory exposed to prospective buyers over a set window, what percentage actually converted into cleared sales?

How do you calculate sell-through rate?
Resellers must track two distinct versions of this metric. The first is your internal inventory sell-through rate, which measures how efficiently your own warehouse or shelving units clear out. The second is the market sourcing sell-through rate, which measures broader buyer demand on platforms like eBay, Marktplaats, and Vinted before you spend a single euro on stock.
Formula 1: Internal inventory sell-through rate
To evaluate your own business health, choose a specific period (typically one calendar month or one quarter). Calculate the ratio between units sold and the total units available for sale during that exact window.
Sell-Through Rate (%) = [Units Sold / (Beginning Inventory + New Listings Added)] × 100
Let us run a real-world scenario. On March 1, you have 200 items listed across your channels. During March, you process thrift hauls and list 50 additional items. Your total inventory pool for the month is 250 units. By March 31, you have shipped 65 orders.
The math runs as follows:
65 / (200 + 50) = 65 / 250 = 0.26
0.26 × 100 = 26% monthly sell-through rate.
If you fail to include the 50 new items added during the month, your denominator shrinks to 200, artificially inflating your rate to 32.5%. That creates a false sense of security. Always measure sold units against the total opportunities to sell that you presented to the market.
Formula 2: Sourcing and market research sell-through rate
When standing in a thrift shop or evaluating a private lot of secondhand goods, you need to know market velocity before committing funds. You cannot wait to see how the item performs in your own shop; you must inspect historical marketplace liquidity.
Market Sourcing STR (%) = (Sold Listings / Active Listings) × 100
On marketplaces like eBay, public search data displays active competitor listings alongside items sold over the preceding 90 days. For example, search for a specific audio receiver model: Sony STR-DH190.
- Active listings currently live: 40
- Completed sold listings over past 90 days: 60
Run the calculation:
(60 / 40) × 100 = 150% 90-day sell-through rate.
To convert this 90-day market metric into a standard monthly run rate, divide the result by three. A 150% 90-day STR equals an estimated 50% monthly sell-through rate. Every month, roughly half as many units sell as currently exist on the open market. That is an exceptional sourcing target, assuming your purchase price leaves adequate gross margin after platform fees and domestic shipping labels.
| Calculation Type | Formula | Primary Use Case | Target Time Horizon |
|---|---|---|---|
| Internal Business STR | Sold Units / Total Available Inventory × 100 | Cash flow analysis, dead stock auditing, portfolio health | 30 days / 1 calendar month |
| Market Demand STR | Sold Units (90 days) / Active Units × 100 | Pre-purchase filtering, price setting, product validation | 90 days normalized to 30 days |
| Retail Velocity STR | Sold Units / Beginning Stock × 100 | Bulk multi-quantity wholesale runs (single SKU) | Weekly or monthly cycle |
How do you check sell-through rate on marketplaces step-by-step?
Checking platform demand requires systematic query refinement. Too many resellers type a vague brand name into an app, see a large sold count, and buy bad inventory. Follow this five-step sourcing protocol to extract dependable data in seconds.
Step 1: Search the exact item specifications
Skip generic umbrella terms. Do not search for "Nike running jacket." Search for the precise item style code found on the interior wash tag (e.g., Nike BV4866-010), or specify exact cut, material, and era details (e.g., Vintage Barbour Beaufort C40 Olive 1990s). On platforms like Marktplaats or Vinted, include regional search variants and model numbers.
Step 2: Record current active listings
Filter your search to display only active, available listings. Note the raw number of competitors. Observe how those competing items are presented: look at photograph quality, item conditions, and whether sellers offer competitive shipping rates. If 20 people are selling the exact same video game console, check if those listings include cords and controllers or if they are bare units.
Step 3: Filter for completed and sold transactions
Toggle the search filters to show sold items. On eBay, select the "Sold Items" checkbox in the navigation panel. On platforms that lack native sold-state toggles (like Marktplaats or Vinted), monitor the speed at which newly listed items receive offers, go into "Reserved" status, or disappear from favorited watchlists. Use historical research aggregators or marketplace research portals where available.
Step 4: Calculate the raw and normalized rate
Divide the sold count by the active count. If you find 15 sold listings over the last 90 days and 30 active listings right now:
15 / 30 = 0.50 (50% 90-day STR).
Divide that 50% by 3 to reach your 30-day baseline: 16.6% monthly STR. That tells you the product moves steadily, but it is not an instant flip. You will likely hold it on your shelf for 45 to 90 days before securing a payout.
Step 5: Inspect total transaction volume behind the percentage
Beware the low-volume trap. If a search yields 1 active item and 1 sold item, the mathematical sell-through rate is 100%. That looks stellar on paper. However, total marketplace demand is exactly one buyer every three months. If two other resellers find that same item next week, market supply triples while demand stays static. Your chances of selling within 30 days plummet. Always ensure the sold volume reflects enough transactions to prove consistent consumer demand.
What is a good sell-through rate for resellers across European categories?
A "good" sell-through rate depends entirely on your business model, storage overhead, and profit margins. High-margin vintage clothing businesses survive comfortably on lower turnover because each sale nets significant returns. High-volume consumer electronics operations require rapid stock turnover to stay ahead of rapid hardware depreciation.
Here is how monthly inventory sell-through benchmarks look across major secondhand categories in the European market:
| Category | Healthy Monthly STR | Average Days to Sell | Typical Net Margin | Operational Focus |
|---|---|---|---|---|
| Fast Fashion (Zara, ASOS) | 40% – 60% | 15 – 30 days | 20% – 35% | Fast churn, rock-bottom buy cost, bundle pricing |
| Vintage Apparel & Workwear | 15% – 25% | 60 – 120 days | 60% – 85% | Detailed measurements, high listing price, patient hold |
| Consumer Electronics & Audio | 50% – 80% | 10 – 25 days | 25% – 40% | Rigorous testing, pristine photos, warranty clarity |
| Collectibles & Vintage Toys | 10% – 20% | 90 – 180 days | 70% – 90% | Safe long-term storage, international collector reach |
| Books, Media & Video Games | 30% – 50% | 20 – 45 days | 40% – 60% | Barcode scanning speed, efficient bubble mailers |
Is a higher sell-through rate always better?
No. This is one of the most common traps for new sellers. An internal monthly sell-through rate above 80% almost always means you are underpricing your inventory. If you list 100 items on the first of the month and 85 are gone within fourteen days, buyers snapped them up because your prices sat far below fair market value. You sacrificed substantial gross profit for raw speed.
Conversely, an internal monthly STR below 10% indicates your capital is stalling. Unless you operate as a high-end antique dealer with negligible storage costs and massive profit margins per piece, a single-digit rate points to severe listing issues: uncompetitive pricing, bad photography, dead search terms, or dead-stock inventory that no buyer wants. Reviewing how many listings you need to make sales helps calibrate whether your slow turnover stems from raw catalog size or weak sell-through dynamics.
Can a sell-through rate exceed 100%?
In market sourcing calculations, yes. When 90-day sold units outstrip current active units, the rate climbs past 100%. If a rare retro gaming console has 15 active listings and 45 sold listings over the last 90 days, the calculation shows 300% (or roughly 100% every 30 days). That reveals severe undersupply. Buyers purchase units faster than resellers source and list them. When you discover products showing market sell-through rates above 100%, you can price near the top of the historical band and expect a rapid payout.
In your internal inventory accounting, the monthly rate mathematically caps at 100% only if you measure strictly against initial plus added stock without restocking the same listing multiple times. If every single item in your store clears out during the month, you hit 100%.
What can distort sell-through rate calculations?
Raw numbers lie when you ignore market context. When you rely solely on standard mathematical formulas without inspecting underlying conditions, several common market variables distort your calculations.
1. Overly broad search terms
Searching for "vintage Levi's jeans" yields tens of thousands of listings. The resulting sell-through calculation tells you nothing useful about the specific pair sitting in your hands. High-waisted Orange Tab 517 flares from 1978 might possess a 120% sell-through rate, while battered mid-2000s standard-cut 501s in an awkward size might struggle at 8%. Run your calculations exclusively on exact fits, specific washes, and verified production eras.
2. The small sample size distortion
You find an obscure industrial testing meter at an estate auction. You check eBay: zero active listings, one sold listing for €250 two weeks ago. The formula suggests an infinite or 100% sell-through rate. In reality, that single transaction may have been an irregular purchase by a factory maintenance crew desperate for discontinued parts. A second buyer might not appear for two years. Do not mistake a fluke transaction for sustainable product liquidity.
3. Extreme seasonal demand spikes
Measuring the sell-through rate of down-filled winter parkas in November gives you numbers that invert completely by May. Heavy wool coats, ski accessories, and electric heaters will display massive liquidity heading into winter. If you source those same items in late February based on preceding 90-day data, you purchase inventory right as buyer interest dries up. Always normalize your sourcing calculations against annual weather patterns and holiday cycles.
4. Multi-quantity retail listings masquerading as individual sales
On platforms like eBay, commercial liquidators often maintain a single listing with 500 units of the same item in stock. The search results show this as one active listing. When viewing sold filters, that listing may show 400 completed sales over three months. A casual calculation suggests an astronomical 40,000% sell-through rate. Do not blend multi-quantity commercial merchant runs with single-item secondhand sales when analyzing market depth.

- ✓Look up the exact style code or tag details instead of broad brand names
- ✓Count how many active competitor listings are live right now
- ✓Filter for completed and sold listings over the past ninety days
- ✓Divide sold items by active ones to get the ninety-day rate
- ✓Divide that result by three to calculate your monthly run rate
- ✓Check total transaction volume so you avoid thin one-off sales
Sell-through rate vs conversion rate vs inventory velocity: What is the difference?
Resellers often use operational terms interchangeably. They track completely different dimensions of your store, and mixing them up leads to mistaken pricing moves.
| Metric | What It Measures | Formula | Primary Optimization Lever |
|---|---|---|---|
| Sell-Through Rate (STR) | Percentage of total physical catalog converted to sales over time | Sold Units / Total Stock × 100 | Sourcing selection, inventory clearing, cross-listing |
| Conversion Rate (CR) | Percentage of browsing visitors who make a purchase | Orders / Page Views (Clicks) × 100 | Photo quality, copywriting, competitive pricing |
| Inventory Velocity / Days to Sell (DTS) | Average calendar days elapsed between listing and sale | Total Listing Days of Sold Items / Total Units Sold | Price drops, bumping schedules, demand matching |
Here is how they intersect: imagine an item receives 1,000 views on Vinted but generates zero offers. Your conversion rate sits at 0%. That points to a problem with your listing details, shipping costs, or visual presentation. Prospective buyers want the product, but your specific offer fails to close them. Conversely, if an item receives only two views in four weeks, your conversion rate is unmeasurable because you face an exposure deficit. Your sell-through rate stagnates simply because buyers never see the item.
How does cross-listing affect sell-through rate across European platforms?
Every European marketplace houses a distinct buyer demographic with unique regional shopping habits. A Belgian buyer searching for an antique copper kettle rarely looks on eBay; they check 2dehands. A vintage streetwear collector in France scours Vinted first. A Dutch consumer hunting for home tools defaults to Marktplaats. An audio enthusiast searching for specialized turntable needles looks straight to eBay's cross-border listings.
When you leave an item on a single platform, its sell-through rate reflects only the liquidity of that single audience pool. Cross-listing that exact same item across multiple regional marketplaces multiplies its exposure without requiring you to invest extra cash into physical stock.
Managing inventory across disparate platforms manually is slow and prone to errors. Omnivaleur publishes to seven channels from one intake form: Marktplaats, 2dehands, Vinted, eBay, Shopify, WooCommerce and Facebook Marketplace (beta). This distribution broadens your exposure footprint instantly.
However, automation must respect platform security architectures. Cross-listing in Omnivaleur runs one browser tab at a time on purpose: parallel publishing is what gets marketplace accounts rate-limited. Staggering your updates protects your seller accounts while ensuring listings propagate across every channel cleanly. When you expose your inventory to seven platforms simultaneously, holding times contract, inventory velocity accelerates, and your overall monthly sell-through rate climbs.
As sales pick up across multiple channels, you need strict stock synchronization. Selling the same jacket on Vinted and Marktplaats within the same hour causes cancelled orders, platform penalties, and angry customers. You must stop selling the same item twice on Marktplaats and Vinted by removing matching listings the moment an order clears.
Actionable strategies: How to increase sell-through rate on stale inventory
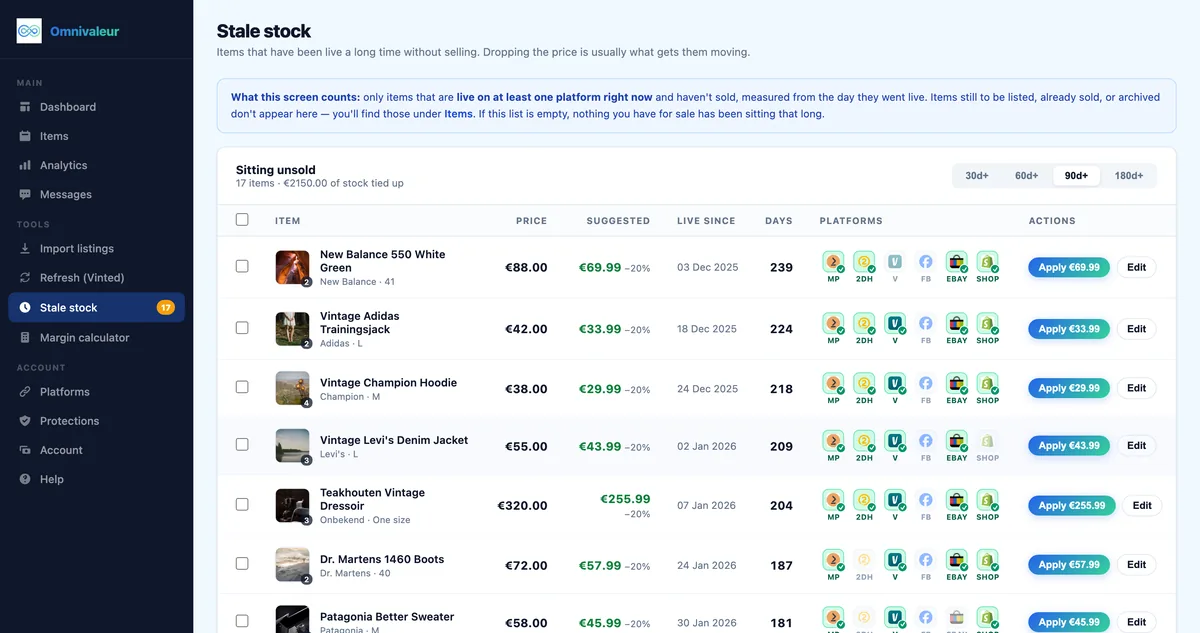
When your monthly inventory review reveals an internal sell-through rate dipping below 20%, do not ignore the warning sign. Stagnant stock consumes shelf space, ties up operational cash, and gradually loses algorithmic visibility on major search feeds. Here is an aggressive operational plan to restore portfolio liquidity.
1. Run disciplined price reduction and markdown cycles
Implement a calendar-based markdown schedule. If an item fails to sell within 30 days, reduce the asking price by 15%. If it remains unsold at 60 days, drop the price by an additional 15% or enable automated buyer offers. Slashing prices on aged stock frees up capital you can reinvest into high-velocity goods.
2. Delist and relist instead of relying on passive bumps
Search algorithms favor new listings. When an item sits for two months on Marktplaats or Vinted, it drifts down search result pages. Rather than paying endless recurring fees for minor visibility bumps, delist stale inventory entirely. Take new primary photographs with cleaner lighting, rewrite the title to capture alternative search terms, and republish the item fresh. Review our strategic guide on relisting vs bumping second hand inventory to master this cycle without triggering automated spam filters.
3. Create value bundles to liquidate slow-moving units
Low-value apparel pieces (such as basic t-shirts, unbranded sweaters, or budget jeans) often carry individual sell-through rates below 5%. The shipping cost alone deters buyers from purchasing a €6 garment. Group three to five complementary items together into a single themed bundle (e.g., "Lot of 3 Men's Vintage Flannels - Size L"). This boosts the perceived value, justifies the parcel shipping charge, and clears multiple units off your inventory log in a single transaction.
4. Purge unsellable dead stock before tax reporting deadlines
Some items are simply mistakes. Sourcing errors happen to every reseller. If an item remains unsold past 120 days despite markdowns and fresh photos, liquidate it. Donate it to a local thrift shop, sell it in bulk mystery boxes at a break-even price, or write it off.
Clearing stale inventory carries legal and fiscal benefits. European tax compliance frameworks like EU DAC7 rules require digital platforms to report seller activity to authorities once you cross 30 transactions or €2,000 in gross annual sales. In the Netherlands, the Belastingdienst DAC7 reporting systems cross-reference these marketplace reports directly with income declarations.
Do not let dead stock take up transaction volume allowances without returning healthy profits. Clean inventory records also simplify compliance under the VAT margin scheme for second-hand goods, ensuring you pay tax strictly on actual gross profits rather than gross receipts. For broader sales compliance, make sure you align with official EU consumer shopping rights on returns and descriptions, especially when selling items across borders.
Worked example: Calculating portfolio ROI and inventory velocity
Let us tie every concept together with a worked example tracking a mid-sized European reseller across one quarter. Consider the operational figures for a seller operating in Eindhoven, sourcing second-hand designer wear and vintage electronics.
Quarterly operational baseline
- Opening inventory (January 1): 400 active items (total acquisition cost: €4,000)
- New inventory acquired and listed (Q1): 200 items (total acquisition cost: €2,200)
- Total inventory exposed during Q1: 600 items (total capital invested: €6,200)
- Units sold during Q1: 210 items
- Total gross revenue generated: €9,450
- Ending inventory (March 31): 390 items
Step 1: Calculate the quarterly sell-through rate
STR = [Sold Units / (Beginning Stock + Added Stock)] × 100
STR = [210 / (400 + 200)] × 100 = (210 / 600) × 100 = 35% quarterly sell-through rate.
Normalized to a monthly metric, this seller clears approximately 11.6% of their total catalog every thirty days. That sits within a stable range for a mixed-category catalog containing vintage collectibles.
Step 2: Calculate average revenue and profit per cleared unit
Average Sale Price (ASP) = €9,450 / 210 units = €45 per item.
Cost of Goods Sold (COGS) for cleared items = 210 units × €10.33 average acquisition cost = €2,170.
Gross Profit before platform fees and shipping = €9,450 - €2,170 = €7,280.
Step 3: Analyze the velocity diagnosis
The seller generated healthy cash flow and earned strong gross margins. However, look at the catalog depth: 390 items remained unsold heading into April. If 150 of those 390 items have lingered in storage for more than 180 days, they drag down overall operational performance.
By identifying those specific stagnant SKUs, delisting them, cross-listing them to secondary channels, or running a clearance sale, the reseller can release €1,500 in locked-up capital. That cash can be redeployed straight into items showing verifiable 90-day market sell-through rates above 80%, instantly accelerating overall business turnover heading into the summer season.
Track your sell-through rate weekly. Maintain clean spreadsheets or inventory software, calculate market demand before spending capital at flea markets or estate sales, and leverage multi-channel distribution to get fresh eyes on every listing. When you run your resale business on hard inventory velocity metrics, consistent profitability follows naturally.
Frequently asked questions
What is the difference between sell-through rate and inventory turnover?
How do you calculate sell-through rate on platforms that do not show sold items?
How does seasonality affect the sell-through rate formula?
Why is my calculated market sell-through rate high but my item is not selling?
Should I calculate sell-through rate by unit count or by euro value?
Keep reading



Stop copying listings by hand
Omnivaleur publishes your item to every platform at once and syncs stock automatically when something sells.
Start free trial